Viscoelastic Testing
There are multiple factors which contribute to haemostasis – e.g. platelets, RBCs.
Standard tests do not consider this, instead focusing on a small part of haemostasis, i.e. small parts of the coagulation cascade, and only up to the initial part of fibrin generation.
Standard tests also take a lot longer to get results back – at least 60 mins compared to 15 mins.
As such, there is an increased utilisation of these tests to guide management of cases when there is suspicion of coagulopathy.
It is felt to be a better representation of ‘in vivo’ haemostasis, though still not a complete picture (e.g. the endothelial component is not represented at all).
A review of the physiology of haemostasis is available here:
http://www.medicalphysiology.co.uk/haemostasis.html
The different forms of viscoelastic testing are very similar.
They measure the viscoelastic properties of the blood sample as it clots whilst it is subjected to low shear stress.
The resistance to this stress can be converted into an electrical signal which is indicative of clot strength.
These tests are done at 37 degrees celsius (so doesn’t take into account the impact of hypothermia on clotting).
The method that this torsion stress is applied is what varies amongst the two main formats.
TEG – ThromboElastoGraphy (the cup rotates, with a static pin in the blood)
ROTEM – ROtational ThromboElastoMetry (the pin moves whilst the container stays still)
The blood is activated by addition of a contact activator, which again differs amongst the different brands.
Kaolin is used in TEG
The ROTEM INTEM profile uses contact activator (to focus on the intrinsic pathway).
The Rotem EXTEM profile uses tissue factors (to focus on the extrinsic pathway).
Other important factors/variations:
Both systems are coated in heparinase, thus neutralising any heparin present in the sample (e.g. on bypass) and just allowing assessment of the underlying coagulation profile.
The ROTEM FIBTEM profile includes platelet glycoprotein IIb/IIIa inhibitor - this means that the MCF is primarily a representation of fibrin, rather than the platelets contribution to clot strength.
This provides different values, so although the clotting profiles are similar, they still need interpretation based on the specific kit.
TEG
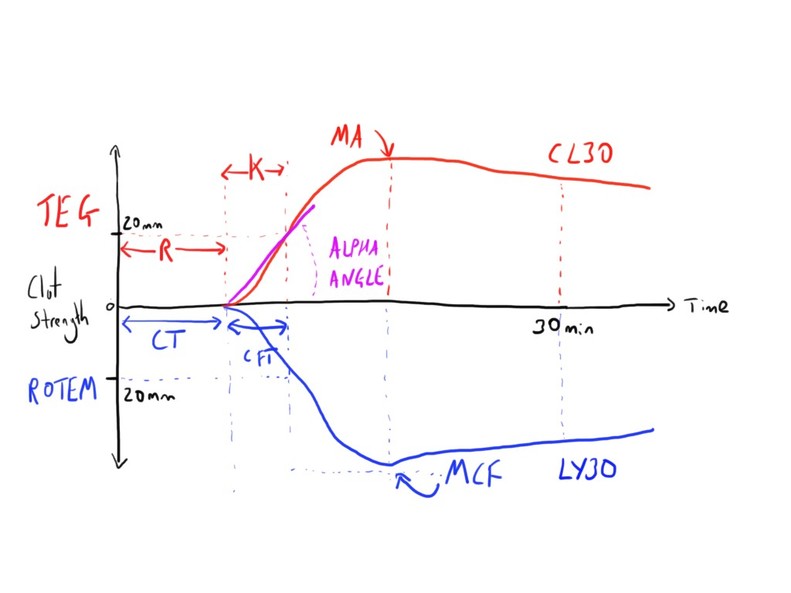
R time – This is the reaction time. Time from the start of test to first clot (amplitude of 2mm)
This is indicative of the concentration of soluble clotting factors.
Normal values: 4-8 mins
K time – This refers to the kinetics. The from the R time to when trace amplitude reaches 20mm. (A particular predetermined level of clot strength)
Normal values: 1-4 mins
Alpha angle – This is the tangent line drawn from curve to the split point (between the R time and K time) – measure rapidity of fibrin build up
Normal value: 47-74 degrees
MA - measure maximum amplitude – represents the strength of the ultimate clot.
This is representative of platelet action (function and number) and fibrinogen concentration.
Normal values - 55-73mm
CL30 and CL60 measure the rate of amplitude reduction at these times after MA (30 or 60 mins).
Measures the degree of fibrinolysis, as it shows how fast the clot breaks down.
Should be < 7.5%
ROTEM
ROTEM has essentially the same components of assessment but with different names and different absolute values:
CT - Clotting Time
CFT - Clot formation time
Alpha Angle
MCF - Maximum Clot Firmness
LY30 and LY60
CT - Clotting Time
CFT - Clot formation time
Alpha Angle
MCF - Maximum Clot Firmness
LY30 and LY60
Uses
There are several scenarios where the use of such testing can be seen as beneficial.
The indications is primarily to guide transfusion strategy, particular the use of blood products that are involved in haemostasis.
They also may be used to predict the need for transfusion e.g. the MA is predictive in trauma.
As such, there are several clinical scenarios where they may be used:
Although they may be of some use, there are some scenarios where the results may be hard to interpret:
The indications is primarily to guide transfusion strategy, particular the use of blood products that are involved in haemostasis.
They also may be used to predict the need for transfusion e.g. the MA is predictive in trauma.
As such, there are several clinical scenarios where they may be used:
- Trauma
- Obstetrics
- Cardiac surgery
- Liver transplantation
Although they may be of some use, there are some scenarios where the results may be hard to interpret:
- Antiplatelet drugs (insensitive to aspirin and clopidogrel)
- LMWH
- Hypercoagulability
Interpretation
The use of TEG/ROTEM allows demonstration of several specific clotting profiles:
· Normal
· Anticoagulants/inadequate clotting factors
· Platelet blockers
· Fibrinolysis
· Hypercoagulation
· DIC – different stages
· Normal
· Anticoagulants/inadequate clotting factors
· Platelet blockers
· Fibrinolysis
· Hypercoagulation
· DIC – different stages
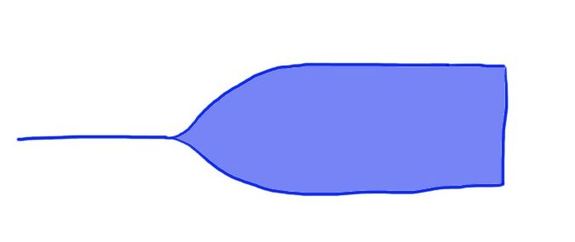
Normal

Looks like a cigar.
Short R time, with large alpha angle to a good MA.
Maintains clot strength for a good period.
Short R time, with large alpha angle to a good MA.
Maintains clot strength for a good period.
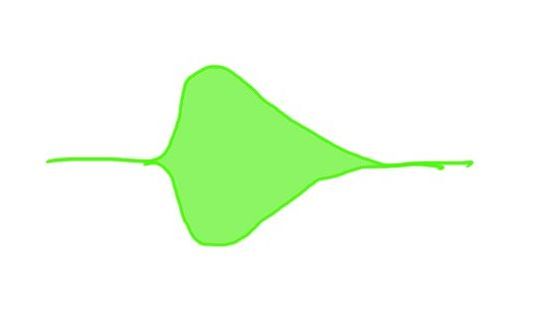
Anticoagulants

Looks like a champagne glass.
Prolonged R time, with smaller alpha angle, and usually a reduced MA.
Prolonged R time, with smaller alpha angle, and usually a reduced MA.
Anti-platelets/Thrombocytopenia

Normal R time but a prolonged K time and lower MA.
Fibrinolysis

Normal R time, K time and MA.
Rapid decrease in clot strength though (may impact on MA)
Rapid decrease in clot strength though (may impact on MA)
As such, some of the profiles can be used to guide management decisions, based on these profiles.
This can be more easily understood if we look at what the different profiles tell us.
Prolonged R time - This suggests inadequate coagulation factors, and thus these should
the target for blood product replacement e.g. FFP
Decreased Alpha Angle - this suggest that the development of the fibrin cross linking is slow to build up.
Decreased MA - this suggest an overall reduced clot strength. This may indicate impaired platelet function or quantity.
Low CL30 - this suggests rapid clot breakdown i.e. fibrinolysis.
Limitations
Some limitations do exist, including limitations of the technique, and challenges of
Implementation.
Implementation.
- Quality of equipment maintenance, calibration and technique is important as it is a point of care test.
- May be more expensive than laboratory tests (training and equipment)
- Insensitive to aspirin and clopidogrel
- Insensitive to impact of hypothermia.
Links & References
- Srivastava, A. Kelleher, A. Point-of-care coagulation testing. CEACCP. 2013. 13(1): 12-16
- Thromboelastometry. Anaesthesia UK. 2017. Available at: http://www.frca.co.uk/SectionContents.aspx?sectionid=147
- Nickson, C. Thromboelastogram (TEG). Life in the Fast Lane. 2014. Available at: https://lifeinthefastlane.com/ccc/thromboelastogram-teg/
- Elbeery, J. Thromboelastography (video) 2013. Available at: https://www.youtube.com/watch?v=SjH05uGSGv0
- Hurn, C. TEG/ROTEM in the real world. SMACC podcast. 2013. Available at: http://intensivecarenetwork.com/756-smacc-hurn-on-tegrotem-in-the-real-world/

